QoE (Quality of Experience) is becoming increasingly important in today’s enterprise video streaming business. By implementing QoE concepts and tools, video streaming platforms can significantly improve the viewer experience and increase viewer retention rates.
In this article, we will explore the key factors that contribute to QoE and how Mlytics Video Stream can help optimize your streaming service to maximize viewer retention.
What is Quality of Service (QoE)?
QoE, or Quality of Experience, QoE is a key metric for assessing user satisfaction with digital services like apps, video streaming, and websites. QoE simply measures user behavior, viewer retention, and customer loyalty.
How to Improve Viewer Retention with QoE
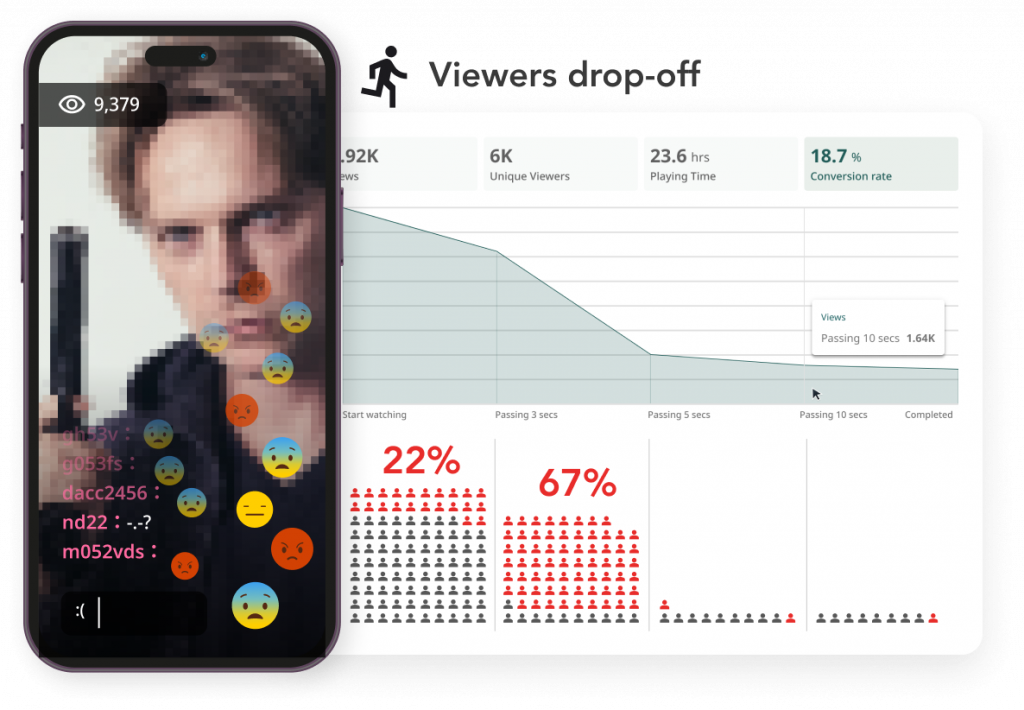
Viewer retention is directly linked to the QoE provided by a video streaming platform. When viewers experience issues such as buffering, poor video quality, or frequent disruptions during playback, their satisfaction decreases, leading to a higher probability of them abandoning the video.
By prioritizing QoE and leveraging the advanced capabilities of Mlytics, streaming services deliver exceptional video streaming experiences that keep viewers satisfied. With real-time analytics, intelligent multi-CDN delivery, adaptive bitrate streaming, and intelligent caching, Mlytics empowers streaming platforms to optimize their QoS and maximize viewer retention.
Content providers can gain a better understanding of viewer behavior by analyzing engagement metrics with other quality of experience (QoE) metrics, such as video startup time, rebuffering percentage, and video quality. Identifying trends and patterns in viewer engagement allows providers to identify areas for improvement and optimize their video delivery strategies.

Engagement Metric
Engagement metrics offer a data-driven approach to understanding audience behavior, optimizing content offerings, and ultimately driving viewer retention. When it comes to evaluating video performance, engagement metrics are just one piece of the puzzle. In fact, they work in tandem with other essential QoE metrics, such as Video Startup Time and Rebuffering Percentage, to give a complete picture of how well a video is performing. By examining these metrics together, it’s easier to identify areas where improvements can be made.
Understanding audience interactions and behaviors is key when it comes to engagement metrics. KPIs play an important role in quantifying these interactions. By tracking and analyzing KPIs, businesses can get a better understanding of how well they are connecting with their target audience and meeting their needs.
Here are some key engagement metrics that serve as valuable KPIs for video streaming:
Views: The number of views a video or content receives is an important metric that reflects the level of audience interest and reach. By tracking views, companies can assess the overall popularity and visibility of their content, providing them with a clear understanding of its impact on their target audience.
Unique Viewers: This Key Performance Indicator (KPI) helps businesses understand the number of individual viewers that have interacted with their content. By tracking unique viewers, businesses can gauge the diversity and size of their audience and analyze trends in viewership over time.
Playing Time: Measuring the duration of active content consumption is a crucial performance metric for assessing audience engagement. Long viewing periods indicate heightened levels of interest and satisfaction, whereas shorter durations may highlight potential areas of improvement.
Bounce Rate: The bounce rate refers to the percentage of visitors who exit a website or content after viewing just one page. If the bounce rate is high, it could indicate that the content is not interesting enough or does not meet the expectations of the viewers.
Watch Time: This key performance indicator (KPI) monitors the overall duration that viewers spend watching a series of videos or content during a specific timeframe. By analyzing this data, businesses can gain insights into audience behavior patterns and pinpoint the content that holds viewers’ attention for extended periods.
Rebuffering Metric
The Rebuffering Percentage is an important measure that quantifies how much rebuffering affects the viewer’s experience. It shows the amount of time the video was buffering compared to the total time it was supposed to play. A higher Rebuffering Percentage means that viewers had more interruptions during their video playback, which ultimately results in a worse Quality of Experience (QoE).

To truly optimize the quality of experience (QoE) and minimize rebuffering, video service providers must focus on elevating various aspects of their video delivery infrastructure. The most effective way to achieve this is by implementing a smart multi-CDN approach, which involves identifying the top-performing CDN based on real-time QoE data. This approach empowers providers to effectively mitigate the effects of network congestion and CDN performance issues, ultimately ensuring a seamless and fast content delivery. That’s why we offer you Mlytics multi-CDN services.
To improve the Rebuffering Metric and overall QoE, streaming services can take several measures, including:
Adaptive Bitrate Streaming: When adaptive bitrate streaming is utilized, the video player can automatically modify the video quality based on the viewer’s internet speed. This helps to minimize the chances of rebuffering.
Video Encoding Optimization: Effective video encoding methods must be utilized to decrease the size of video files while still maintaining their quality. This is essential for providing seamless streaming experiences.
Real-Time Analytics: By using QoE analytics, such as the Rebuffering Metric, streaming services can keep a close eye on their performance and detect any potential problems beforehand.
Video Startup Time metric
When users click the play button, they anticipate the video to start playing without any delay. If there is a delay, it may result in user frustration and cause them to lose interest in the content. It precisely measures the amount of time that elapses between a viewer commencing playback and the video actually starting to play.
This metric is crucial in assessing the viewer’s initial engagement with the content and overall experience. Various factors, corrupted video files to faulty transcoding, network issues, and unavailability of video segments on the CDN, can cause this delay.
Using content delivery networks (CDNs): Choosing a reliable and well-optimized CDN can greatly enhance the performance of video delivery and minimize video delay. Look at the Mlytics Multi-CDN.
Reducing the number of Ads: Ads can disrupt the viewing experience of videos and result in decreased viewer retention. To enhance the quality of experience, video streaming platforms have the option of either minimizing the frequency of ads or inserting them at the start or end of the video.
Last Words
Mlytics Video Stream ensures a seamless and engaging viewer experience. From content ingestion and transcoding to content distribution, adaptive bitrate streaming, network optimization, and viewer experience, Mlytics Video Stream ensures excellent quality of experience for video content.


