
When Mlytics was first founded, we wanted to create a tool that can not only collect all the CDN performance data the Smart Load Balancing needs for GSLB / CDN optimization, but also give our actual users a convenient tool to understand how each CDNs are performing globally.
Initially, a system was created to collect CDN performance data, but we didn’t turn it into an interactable user interface because visualizing all the data was proven to be a huge challenge. Now we’ve come up with a new and simplified way to present all these data we’ve collected in a clean and interactable interface.
We are thrilled to announce our brand new take on Real User Monitoring: Mlytics Pulse, a new and effective way to lookup and compare CDN performance date in a snap.
It’s like map hack for CDN
Ever wondering which CDN performs better when trying to compare them? Without the proper tool, doing so is almost like trying to figure out where the enemy is in the fog of war.
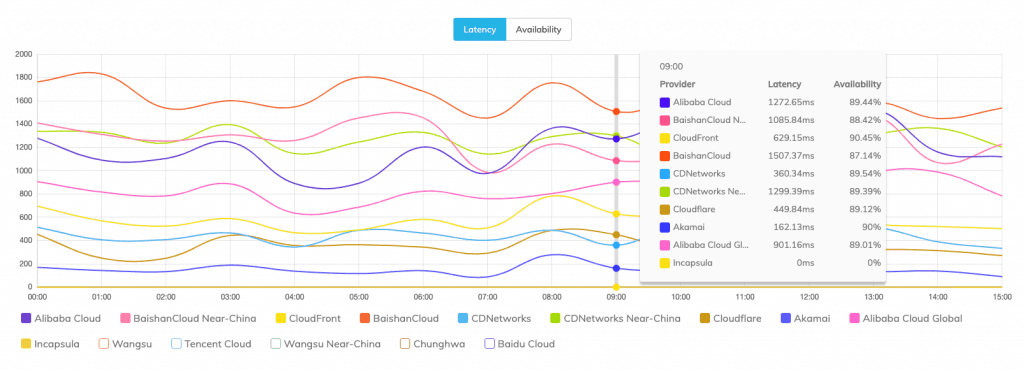
The chart will give you two key information: latency and availability, which you can breakdown into different regions or a specific country. For the latency data, we’re measuring TTFB (Time To First Byte), which measures the duration from the user or client making an HTTP request to the first byte of the page being received by the client’s browser.
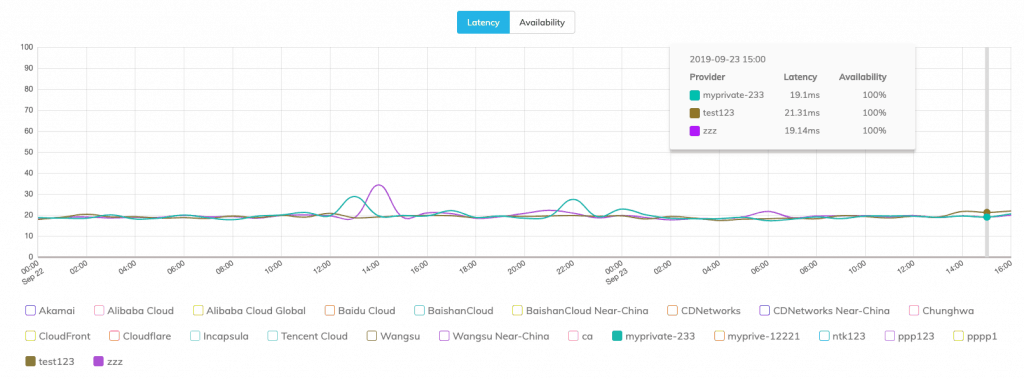
By default, the chart will show all the CDNs that are available on the Mlytics platform. But if you have a Mlytics Enterprise account, you can include a custom file URL and project it onto the chart for performance benchmarking purposes.
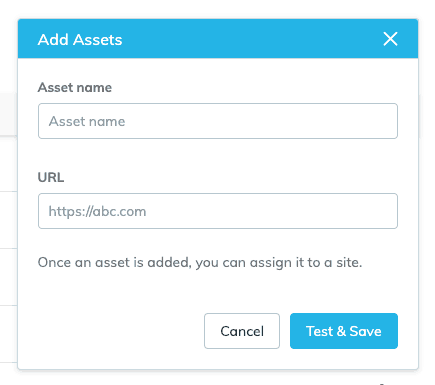
An ‘Add assets’ button will be available under all Enterprise-tier account, which users can define the file URL path and include it to the list. Once an asset is added, it will be included in the assets list and will be projected to chart which allows you to compare and monitor its data.
Make Smart Load Balancing yours
All the data by default are collected by our system on the internet globally, but in order to truly see how these CDNs are performing based on your website, it is recommended to install the “Beacon Code” on your website.
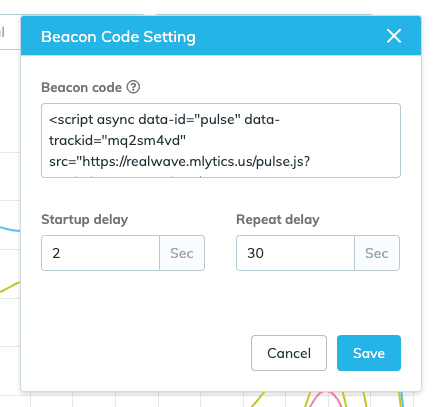
Once installed, the performance data of all CDNs on the chart will reflect based on your website’s current status. The collected data will give the Mlytics platform a better idea of which CDN works best for you in different regions.
This can further improve the performance of your website since now Smart Load Balancing is making decisions based on the status and performance of your website.
Try Pulse today
This is just a beginning for Pulse, we have more features planned for this that can help users to better understand all CDNs and improve website performances. We’ll also be covering more on the use case in the near future.
Sign up or log in and give it a try today, let us know what you think!

")
